Case Studies

Discover our work in the field.
#3DTakeOver

Great things are done by a series of small things.

blog-geo3-1.jpg

September 22, 2013

by Scotty Fletcher | 26 June 2013

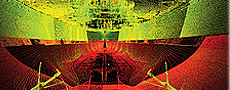
Geospatial professionals collect point-cloud data at a race track with the SmartGeoMetrics ProScan G-Series mounted on a golf cart.

A client who develops auto racing video games needs thousands of images of multiple real world racetracks all over the world – including the track itself, grandstands and the pit areas – and software that can model these images in 3D.

The answer is point cloud data, of course, but, how to collect it?

Renting the tracks to gain exclusive access for car-based sensors or renting aircraft for multiple passes with airborne scanners is too expensive and takes too long. And since these tracks are all over the world, it is difficult to transport the equipment quickly and cost-effectively.

What if there was a way to make a terrestrial-based 3D laser scanner mobile? That’s what developers at SmartGeoMetrics and Germany-based p3dsystems were thinking when the companies created the ProScan G-Series.

“You simply attach the unit to a steady cam vest or dolly and collect data as fast as you can walk,” said Sam Billingsley, vice president of business and product development at SmartGeoMetrics, a division of SmartMultiMedia Inc., a North American reseller of the ProScan G101. “To completely scan an entire racetrack takes hours instead of days.”

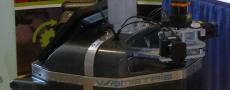
The SmartGeoMetrics ProScan G-Series is demonstrated mounted on a rolling cart.

As Billingsley is quick to point out, the system is an accessory to be used with your current technology. It is highly adaptable because it can be utilized on a mobile platform, such as a dolly, a steady cam rig or even a backpack. And, it isn’t just for racetracks.

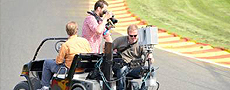
“We have scanned shorelines, climbed in the front of boats and even sat on the back of golf carts while we drove around a track,” said Billingsley. “And if you really need high accuracy, you can always take it off and put it on a tripod or you can just walk slower.”

The modular system, which breaks down into Pelican cases and can easily be transported as luggage on any commercial flight, allows users to combine the speed of a mobile scanner with the portability of a static scanner. Perhaps best of all, it is compatible with most phase-based scanners. You simply bolt your scanner on top of the dolly, and voilá, you have a mobile scanner. You don’t need a separate scan head because it adapts to what you already own.

“This is one of the first accessories on the market that literally extends the lifespan of your existing equipment,” said Billingsley. “In scanning technology, equipment typically becomes outdated after just two or three years. Now you can create a brand new mobile scanner utilizing what you already have.”

There is only one ProScan G-Series system available in North America with two more under contract. It comes with a tablet, as well as the PCloud software required to run it on your scanner and for post-processing.

The ProScan fills a hole in the market when a job is bigger than what can be effectively accomplished with a tripod, but too small for aerial LiDAR or fixed mobile scanning.

“If we need to cover hundreds of square miles, we’ll fly it, but there are lots of upfront costs with that. And if you use helicopters and aircraft, you will capture more data, but with lower accuracy and resolution,” said Billingsley. “This system opens up a tremendous amount of opportunities as far as GIS mapping goes. If you already have a scanner that is supported by this equipment, you simply bolt your scanner to it and you’re off and running.”


blog-pob7.jpg

September 22, 2013

By Mark Evangelista

The USS Missouri dwarfs a laser scanner ready to capture the historic ship that served its country in World War II, Korea and the Persian Gulf.

When the USS Missouri was decommissioned in 1992, the 887-foot-long Iowa-class battleship looked tired. Its worn and pitted teak deck had supported hundreds of naval officers and their crews through three wars spanning five decades. It was on this deck that Gen. Douglas MacArthur accepted Japan’s unconditional surrender in a ceremony on Sept. 2, 1945, ending World War II and securing the USS Missouri’s place in history. However, the ensuing years and battles had left multiple scars on the noble ship–particularly in the form of rust.

The USS Missouri had actually been decommissioned once before, in 1955. Thirty-one years later, the Missouri underwent an extensive modernization of its weaponry. Equipped with four Tomahawk missile launchers, it was recommissioned and called into action for Operation Desert Storm. Six years later, in 1992, “Mighty Mo,” the last battleship built by the United States, was finally allowed to rest.

For the next several years, the magnificent vessel remained docked at the Puget Sound Naval Shipyard in Bremerton, Wash. Then, in May 1998, the Navy officially granted the battleship’s care to the nonprofit USS Missouri Memorial Association Inc. The donation launched a new mission for the historic battleship as a floating World War II museum, docked next to the USS Arizona on Pearl Harbor’s Battleship Row.The museum opened on Jan. 29, 1999, a testament to the vision and perseverance of the association’s directors. But the directors had an even bigger vision in mind–one that involved repairing and preserving the battleship for generations to come.

For the next several years, the magnificent vessel remained docked at the Puget Sound Naval Shipyard in Bremerton, Wash. Then, in May 1998, the Navy officially granted the battleship’s care to the nonprofit USS Missouri Memorial Association Inc. The donation launched a new mission for the historic battleship as a floating World War II museum, docked next to the USS Arizona on Pearl Harbor’s Battleship Row.The museum opened on Jan. 29, 1999, a testament to the vision and perseverance of the association’s directors. But the directors had an even bigger vision in mind–one that involved repairing and preserving the battleship for generations to come.

A War on Rust

The Missouri’s exterior hull, imaged from the inside, was taken just aft of the propellers and rudders.

That vision was realized in October 2009 when the Missouri was moved to Pearl Harbor Naval Shipyard’s largest dry-dock facility for a three-month, $18-million preservation project. The project included inspecting and refurbishing the hull, sandblasting and repainting the ship’s exterior, replacing rusted steel, and installing a system to monitor corrosion. It also included a comprehensive documentation project that incorporated 3D laser scanning, high-dynamic-range photography and traditional surveys. “Having the battleship Missouri in dry dock provided a unique opportunity to completely scan the ship while it was out of the water,” says Michael A. Carr, president and CEO of the USS Missouri Memorial Association. “It was an opportunity we will not see again for decades and certainly one we did not want to miss.”

A month before the preservation project began, Carr and other association directors had met Richard Lasater, president of Smart GeoMetrics, a division of Houston-based laser scanning firm Smart MultiMedia, at the Historic Naval Ships Association conference in Alabama. Smart GeoMetrics had scanned the interior of another historic battleship, the USS Texas, earlier in the year, and Lasater was eager to demonstrate the results.

A point cloud shows the bridge and surrender deck of the USS Missouri, the site of Imperial Japan’s unconditional surrender, which ended World War II.

After seeing the photographic panoramas and video flythroughs, the association directors were impressed. The technology offered the potential to improve the overall visitor experience at the museum. If they didn’t act then, they probably wouldn’t have the chance in the future. “There is no way to complete an accurate scan of an entire ship while it is in the water,” Lasater says. “Not only is it impossible to image areas below the waterline, even on a calm day, the tiniest movements of the water and ship would degrade scan accuracy.”

The budget for the preservation project was already set. But the association directors decided they had to make the documentation project work. Through an extraordinary amount of teamwork, the project was funded at a level that was acceptable to all participants, and Smart GeoMetrics began honing its strategy.

Calling in the Big Guns

Scan team member Donald Axtell positions a Leica HDS 6000 laser scanner near a commemorative plaque on the surrender deck of the USS Missouri.

The documentation effort would be the last part of the preservation project before the Missouri was returned to its home on Battleship Row in January 2010. Smart GeoMetrics and its team would have a four-day window to scan the vessel as scaffolding and protective covers were removed. The massive endeavor would require three scanning crews, each equipped with a Leica HDS laser scanner, to complete the project. A fourth crew was assigned to create and maintain the survey control network. “The Missouri is a very, very big ship, and we only had four days to complete an estimated 14 days worth of work among an army of shipyard workers,” Lasater says. “The ship’s location in Hawaii also made logistics a bit challenging.”

However, Smart GeoMetrics was up to the task. The firm quickly assembled a team of HDS professionals from Meridian Associates in Houston and As-Built Modeling Services Inc. in nearby Pearland, Texas, with Houston-based Mustang Engineering Inc. providing special assistance.

The team arrived onsite January 3 and established a control network of more than 400 points. Crews then captured scans at 160 locations on and around the ship’s exterior and took thousands of photographs–5,400 in all. “The documentation teams were really moving fast on this project, and not all of the ship was accessible at the same time,” says Jonathan White, a senior project manager for Meridian, who headed up one of the scan crews. “We were working in and around dockyard preparations to return the ship to sea.”

By January 6, one day before the Missouri was scheduled to leave dry dock, the scanning and photography work was finished. “Ships such as the Missouri entail a great combination of grace and beauty combined with an industrial structure that comes out very well in scan data,” Lasater says. “This was an exciting project that just would not have happened if such a great team of companies and professionals had not been able to collaborate and contribute their expertise.”

With the scans in hand, the team turned its attention to the next phase of the project–turning data into deliverables.

A Lasting Legacy

A point cloud of the USS Missouri’s port bow from below reveals a virtual snapshot of the historic naval vessel.

The scans of the battleship generated billions of data points that the team immediately began processing into point clouds, CAD drawings and 3D models.

The team also decided to take the deliverables one step further by adding holograms, a capability provided by Austin, Texas-based Zebra Imaging. “The technology from Zebra Imaging is so compelling,” Lasater says. “Zebra agreed to provide the initial examples [at no charge] as part of the team. However, the Missouri Memorial Association immediately realized the value of the technology and is already working with us to provide specific exhibits and materials.”

This project marks the first time holograms have comprised part of an archival record. The results of the entire documentation project will be used by the USS Missouri Memorial Association as a historical record and for ongoing maintenance and educational purposes.

On Jan. 30, 2010, the Battleship Missouri Memorial officially reopened to the public looking much like the day it was first launched 66 years ago. The freshly painted steel glistens in the sunlight. The teak deck gleams. Tours and signs have been enhanced, and special touches have been added to improve the ship’s capabilities as a venue for special events. But the Missouri Memorial Association directors and the Smart GeoMetrics team are still working behind the scenes brainstorming new ideas to create and maintain a fitting memorial worthy of the battleship’s legacy. “I am very happy with what is being produced and excited to start planning for how we can use it here to improve the overall visitor experience,” Carr says.

Workers scramble to complete the scan project while the USS Missouri is in dry dock.

Sidebar: Missouri Quick Facts
USS Missouri (BB-63)

Class: Iowa-class battleship

Length: 887 feet

Height: 209 feet from keel to mast

Beam: 108 feet

Weight: 58,000 tons (full load); 45,000 tons (unloaded)

Speed: In excess of 30 knots (35 mph)

· Iowa-class battleships were designed for speed and firepower.

· Designing the Missouri took 175 tons of blueprint paper.

· The ship was built in three years and required more than 3 million “man-days” to complete.

· Only four Iowa-class battleships, including the USS Missouri, were built during World War II.

· The Mighty Mo is 5 feet longer and 18 feet wider than the RMS Titanic.

· If you could stand the ship on end, it would be 332 feet taller than the Washington Monument.

· Mighty Mo’s trademark feature is its set of nine 16-inch guns. Each barrel is approximately 67 feet long, weighs 116 tons, and can fire a 2,700-pound shell 23 miles in 50 seconds with pinpoint accuracy.

· The Missouri was the last U.S. battleship to be launched and the last to be decommissioned.

Source: www.ussmissouri.com


blog-chron2-1.jpg

September 22, 2013

SANDRA BRETTING, For the Chonicle | January 10, 2010

blog-chron
Photo By Eric Kayne/ChronicleDoug Smith, left, and Richard Lasater, principals with Smart GeoMetrics, show their $150,000 camera with the results of their imaging of the Alamo on the monitor. Their business creates 3-D images.

If a picture is worth a thousand words, imagine what a 3-D technology that captures half a million measurements a second, to an accuracy of 2 millimeters, might be worth.

The technology is called high-definition laser scanning, and it’s often used by petrochemical companies to measure tanks, pipelines and the like. However, local small business Smart GeoMetrics adapts the technology to digitally document everything from historic buildings to a U.S. battleship.

“We like working with companies who have never heard of 3-D laser scanning before,” company co-founder Richard Lasater, 44, said. “Or if they have, they don’t know all of its applications.”

From Switzerland
The system used by Smart GeoMetrics was developed in Switzerland by a company that pioneered surveying equipment. Using a camera that costs some $150,000 and software that costs another one-third that amount, the company has scanned everything from a local church slated to be demolished, to the USS Missouri, the 877-foot-long battleship that is part of the Pearl Harbor memorial in Hawaii.

The results are 3-D images that can be used as historical documents, to help with ongoing maintenance of a building or object or for educational purposes. In fact, the company’s other co-owner, Doug Smith, has a background in long-distance learning with groups ranging from the Houston Museum of Natural Science to the Houston Zoo.

“In a few days, we can scan something that would take weeks to record by hand,” Smith, 45, said. “It’s a great tool for lesson planning, because it allows people to see spaces that normally aren’t accessible.”

The Missouri’s hull
For instance, with the Missouri, the company scanned the hull of the ship in late December, which is plated with more than 13 inches of steel.

“We worked with three other local companies to get that task accomplished,” Lasater said.

“Now, the Battleship Missouri Memorial has a permanent record they can use in their exhibits, or if they need to work on the hull again.”

For Immanuel Lutheran Church in the Heights, the company scanned the inside and outside of the original church, which was built in 1927 and added to in 1932.

Plans call for the old structure to be demolished in May.

“This way, we’ll be able to preserve the digital images and make them available to people who would like to see them … like architectural students, so they can have precise information on what it looked like,” said Ken Bakenhus, president of the congregation. “The congregation has wanted to demolish the building for many years now, but this way we’ll have a lasting record of it.”

Donated services
Smart GeoMetrics, a subsidiary of a seven-person small business called Houston-based Smart MultiMedia, donated its services for that project, Bakenhus said. Smart MultiMedia is owned by the same two men and provides such services as graphic design, Web development and video production.

Founded in 2006, Smart GeoMetrics began using this particular 3-D laser scanning technology in 2008. The owners declined to provide revenue figures.

A point cloud
The company has since scanned a computer system for Hewlett-Packard Co., for use by overseas call center service engineers when they haven’t actually seen the product, and for petrochemical company Texmark, which wanted a model of one of its chemical distillation units.

Lasater, who has experience in media production and once worked for Republic Pictures in California, said the company also has started to scan federal buildings through an initiative of the General Services Administration.

“It provides very technical, very detailed information on a building’s structure,” Lasater said. “While the technology doesn’t replace blueprints, it does supplement them for when the federal government will need to renovate or expand their buildings.”

According to Lasater, a current example of such technology can be found in the 20th Century Fox movie Avatar, which shows a 3-D point cloud of a large tree.

While that image is of an imaginary object, the actual image is similar for buildings, boats and the like, Lasater said.


blog-viametris-1.jpg

August 28, 2013

The iMMS is the perfect system for quickly collecting dimensional and photographic information in interior and close quarter environments. This revolutionary system combines three LiDAR sensors (3 cm accuracy) with a 360° panoramic camera to provide photo-realistic point cloud data in a mobile platform. The result is a system that digitizes an environment as quickly as you can walk through it!

Indoor Mobile Mapping with the Viametris iMMS

The iMMS maintains its position using “SLAM” (Simultaneous Localization and Mapping) technology with it’s forward facing LiDAR sensor. However, the most optimal results are achieved by post processing the data to use geometric similarities in the environment as additional constraints. This is accomplished using Viametris’ PPiMMS Software Suite. PPiMMS is a powerful post-processing software that automatically corrects any drift in from the SLAM processing in order to compute more precise point cloud results. From an initial acquisition, imported from a Viametris iMMS device, the user builds their own project to correct the potential drifts, add some specific constraints, compute the 3D points clouds and finally export these 3D datasets. Installed on the office work station, PPiMMS can also be used as a stand-alone viewer. PPiMMS can also be used to provide users with a “Streetview” type interface that allows them to navigate the panoramic images from the collected data in a familiar interface.

Mobile mapping has clear advantages over traditional static systems due to the decreased field collection times. High costs due to the necessities of accurate localization has traditionally been the stumbling block of mobile mapping. However, Viametris has overcome this issue with their specific LiDAR-based SLAM technologies. By using SLAM for real-time mapping of the environment and geometric similarities in the environment to further enhance the accuracy during post processing, the iMMS is able to operate without GNSS/GPS receivers or an IMU (Inertial Measurement Unit). These facts are reflected in the iMMS’ ability to excel at mapping indoors and in its low retail price compared to traditional mobile mapping systems.

SmartGeoMetrics is the exclusive US distributor of the iMMS providing sales, service, support, and rentals of the iMMS for clients that are not yet ready to purchase.

Contact SmartGeoMetrics today for more information on the iMMS or to schedule a demo.

View a Video of the iMMS in action collecting data at ILMF 2013.

Viametris iMMS


blog-accuracy.jpg

August 28, 2013

One of the most consistent issues that I am asked to opine on early in a project is that of the accuracy of one particular scanhead versus another. Those of us in the industry have known for years that the manufacturers have done an excellent job of stating the accuracy of their instruments in ways that eliminate the average consumers’ ability to perform a direct comparison. After making a concerted effort to understand the issue and somehow correlate it with my own experiences using various makes and models I have come to the conclusion that the manufacturers  are not necessarily being purposefully obtuse. There are some real, academic disagreements with how best to quantify and state the accuracy of a given instrument (although I still think the marketing department has editorial control of the tech sheets!) In case it was not obvious, I am not an Engineer (although I teach many how to scan), or a physicist (although I have seen every episode of the Big Bang Theory), however, neither are a lot of my clients. So, my intention here is to try and explain the variables and come to some conclusions in a way that can be understood by those of us that do not enjoy advanced statistics (my apologies to those who do).

When it comes to a laser scanner there are three basic types of errors that can lead to inaccuracies.

  • Laser Range Error
    • Comprised of two types: Range Error & Linearity Error
  • Range Noise
  • Mechanical Error
    • Comprised of two types: Horizontal Error & Vertical Error

Let’s take a closer look so that we can better understand each of these three types of error.

Laser Range Error: No system is perfect and that includes laser scanners. When scanners are produced they are tested in measuring a target of known reflectivity at various known distances. This is repeated with targets of differing reflectivity producing a range of range values. The error in capturing the correct distance or range from the scanner to those targets is the range error. Comparing this error over multiple measurements (say 5000-15000 measurements) an error function is created and stored in the scanhead. This function is the Range Calibration. The Range Calibration is different for every individual scanner and it may change over time. This error is one that is recomputed when you send a scanner in to be calibrated. A second test (same procedure as before) is performed after the Range Calibration has been completed. The resulting error found in this test is referred to as Linearity Error. The Linearity Error is plotted on a curve centered on zero. A measurement of the offset of that plotted curve from zero is the stated Linearity Error. Think of it as “as good as it can get on a perfectly calculated scanhead”.

Range Noise: Have you ever looked at a point cloud of a flat wall and noticed that as you zoom in on a profile view that the point cloud is not a smooth flat surface but a noisy grouping of points? That is Range Noise. Technically it is the difference between each individual measurement and the mean distance to an object. There are several things that impact Range Noise. First is the distance to the object being scanned, second is the albedo or reflective quality of the object. However, scanning rates also have a large impact on range noise. Essentially the  higher the scan rate the greater the Range Noise. This is where one of those academic issues comes into play. Some prefer a statement of Range Noise as an absolute (people with slower scan rates) while other insist that the Range Noise should be normalized (divide the range noise by the square root of the scan rate). If you are comparing two different instruments it’s important to know which way the Range Noise was calculated.

Mechanical Error: When considering most modern laser scanners they accomplish scanning in a 360° x 2×0° field of view by deflecting the laser via a rotating mirror in the vertical axis and spinning the scanhead around on a horizontal axis. These mechanical devices (mirror & servos) are also subject to error. While these mechanical devices are aiming the laser beam for us the scanner is calculating and recording the angle and bearing of the mirror and the scanhead each time the instruments sends out a laser pulse. In reality there is a difference between the measured angle and the actual angle in both the horizontal and vertical angles. This is referred to as the Angular Error. As this error is in the bearing used to calculate the XYZ position of each point in the point cloud the error increases as the range increases. For this reason it is typically stated as a Radiant value. This allows you to understand how the angular error increases at range. 1 mrad angle means 1mm spacing per meter in distance from the scanhead. For example the Z+F 5010/HDS7000 has an Angular Error of 0.122 mrad. This means that the error is 1.2mm at 10m, 6mm at 50m, and 12mm at 100m. This mechanical error is also recomputed when you send a scanner in to be calibrated. This is done by scanning a known 3D environment. This allows for the calculation of a mean angular error which is used as a correction against angular errors. The point to take from this section is that angular errors have little impact on measurements at close range but they can have a big impact on data scanned at long range.

The root of the problem is that these three types along with the physical properties of lasers make for some rather complicated outcomes while most customers want a simple (single) number as an answer.  Sadly I can’t give it to you. I think that we need to keep seeing all of those confusing figures using whatever each manufacturer considers the gold standard in error calculation to be. The fact is, the level of error is very different if even one variable (range, angle to object, reflective quality of object, etc.) is altered. Many don’t think about the fact that this means there is a variance of accuracy even within one scanworld. But that doesn’t mean that we can’t help add to the overall understanding of the situation.

So, here is my proposal. Why don’t we develop a standard sample grid. An easy chart that like the EPA Mileage Certificate or the Nutritional Pyramid gives us an accurate snapshot of the performance of the instrument? I’m thinking a grid with various distances along one axis and various surfaces along the other showing the actual mean error of the instruments measurement compared to the known measurement. I know it’s not perfect; neither is the EPA’s Mileage Certificate. They calculate highway mileage driving in controlled conditions without considering a lot of real world applications. In other words, I will never get the exact numbers that they post on the sticker, but at least I can see that my Toyota Sequoia will take a lot more gas than my wife’s car. And that is what most customers are looking for; a direct comparison.


blog-accuracy-1.jpg

August 28, 2013

One of the most consistent issues that I am asked to opine on early in a project is that of the accuracy of one particular scanhead versus another. Those of us in the industry have known for years that the manufacturers have done an excellent job of stating the accuracy of their instruments in ways that eliminate the average consumers’ ability to perform a direct comparison. After making a concerted effort to understand the issue and somehow correlate it with my own experiences using various makes and models I have come to the conclusion that the manufacturers  are not necessarily being purposefully obtuse. There are some real, academic disagreements with how best to quantify and state the accuracy of a given instrument (although I still think the marketing department has editorial control of the tech sheets!) In case it was not obvious, I am not an Engineer (although I teach many how to scan), or a physicist (although I have seen every episode of the Big Bang Theory), however, neither are a lot of my clients. So, my intention here is to try and explain the variables and come to some conclusions in a way that can be understood by those of us that do not enjoy advanced statistics (my apologies to those who do).

When it comes to a laser scanner there are three basic types of errors that can lead to inaccuracies.

  • Laser Range Error
    • Comprised of two types: Range Error & Linearity Error
  • Range Noise
  • Mechanical Error
    • Comprised of two types: Horizontal Error & Vertical Error

Let’s take a closer look so that we can better understand each of these three types of error.

Laser Range Error: No system is perfect and that includes laser scanners. When scanners are produced they are tested in measuring a target of known reflectivity at various known distances. This is repeated with targets of differing reflectivity producing a range of range values. The error in capturing the correct distance or range from the scanner to those targets is the range error. Comparing this error over multiple measurements (say 5000-15000 measurements) an error function is created and stored in the scanhead. This function is the Range Calibration. The Range Calibration is different for every individual scanner and it may change over time. This error is one that is recomputed when you send a scanner in to be calibrated. A second test (same procedure as before) is performed after the Range Calibration has been completed. The resulting error found in this test is referred to as Linearity Error. The Linearity Error is plotted on a curve centered on zero. A measurement of the offset of that plotted curve from zero is the stated Linearity Error. Think of it as “as good as it can get on a perfectly calculated scanhead”.

Range Noise: Have you ever looked at a point cloud of a flat wall and noticed that as you zoom in on a profile view that the point cloud is not a smooth flat surface but a noisy grouping of points? That is Range Noise. Technically it is the difference between each individual measurement and the mean distance to an object. There are several things that impact Range Noise. First is the distance to the object being scanned, second is the albedo or reflective quality of the object. However, scanning rates also have a large impact on range noise. Essentially the  higher the scan rate the greater the Range Noise. This is where one of those academic issues comes into play. Some prefer a statement of Range Noise as an absolute (people with slower scan rates) while other insist that the Range Noise should be normalized (divide the range noise by the square root of the scan rate). If you are comparing two different instruments it’s important to know which way the Range Noise was calculated.

Mechanical Error: When considering most modern laser scanners they accomplish scanning in a 360° x 2×0° field of view by deflecting the laser via a rotating mirror in the vertical axis and spinning the scanhead around on a horizontal axis. These mechanical devices (mirror & servos) are also subject to error. While these mechanical devices are aiming the laser beam for us the scanner is calculating and recording the angle and bearing of the mirror and the scanhead each time the instruments sends out a laser pulse. In reality there is a difference between the measured angle and the actual angle in both the horizontal and vertical angles. This is referred to as the Angular Error. As this error is in the bearing used to calculate the XYZ position of each point in the point cloud the error increases as the range increases. For this reason it is typically stated as a Radiant value. This allows you to understand how the angular error increases at range. 1 mrad angle means 1mm spacing per meter in distance from the scanhead. For example the Z+F 5010/HDS7000 has an Angular Error of 0.122 mrad. This means that the error is 1.2mm at 10m, 6mm at 50m, and 12mm at 100m. This mechanical error is also recomputed when you send a scanner in to be calibrated. This is done by scanning a known 3D environment. This allows for the calculation of a mean angular error which is used as a correction against angular errors. The point to take from this section is that angular errors have little impact on measurements at close range but they can have a big impact on data scanned at long range.

The root of the problem is that these three types along with the physical properties of lasers make for some rather complicated outcomes while most customers want a simple (single) number as an answer.  Sadly I can’t give it to you. I think that we need to keep seeing all of those confusing figures using whatever each manufacturer considers the gold standard in error calculation to be. The fact is, the level of error is very different if even one variable (range, angle to object, reflective quality of object, etc.) is altered. Many don’t think about the fact that this means there is a variance of accuracy even within one scanworld. But that doesn’t mean that we can’t help add to the overall understanding of the situation.

So, here is my proposal. Why don’t we develop a standard sample grid. An easy chart that like the EPA Mileage Certificate or the Nutritional Pyramid gives us an accurate snapshot of the performance of the instrument? I’m thinking a grid with various distances along one axis and various surfaces along the other showing the actual mean error of the instruments measurement compared to the known measurement. I know it’s not perfect; neither is the EPA’s Mileage Certificate. They calculate highway mileage driving in controlled conditions without considering a lot of real world applications. In other words, I will never get the exact numbers that they post on the sticker, but at least I can see that my Toyota Sequoia will take a lot more gas than my wife’s car. And that is what most customers are looking for; a direct comparison.


blog-waterworks.jpg

August 28, 2013

Water Works Cistern

In early January, the Houston Chronicle highlighted one of Buffalo Bayou Park’s most fascinating features. Below the signature lawn being developed as The Water Works performance area, north of the existing Lee and Joe Jamail Skate Park, sits an unused City of Houston water reservoir. This 100,000-square-foot area has enormous potential. While there is currently no funding to develop the “Cistern,” as it has been dubbed,  SmartGeoMetrics has volunteered to acquire 3D imaging data of the cavernous space. Their work will help the Buffalo Bayou Partnership (BBP) accurately document the Cistern’s current as-is condition, conceptualize ideas for developing the space, and, with luck, facilitate funding. Imaging is expected to be completed by late summer. SmartGeoMetrics’ imaging will be given to the University of Houston’s Texas Learning and Computation Center (TLC2) who will vet a web-based public ideas process to come up with creative and sustainable potential uses for the Cistern. Stay tuned for details on this public ideas process!


blog-geomagic-1.jpg

August 28, 2013

SmartGeoMetrics Now Authorized Geomagic Distributor

SmartGeoMetrics adds Geomagic software to their growing list of offerings to users of 3D Imaging data. Long known for having the best meshing application for point cloud data,Geomagic offers software solutions for reverse engineering, parts inspection, deviation analysis and more. As with all SmartGeoMetrics products, industry specific training and educational services will also be available.

“Our quest is to be able to provide our clients with the best solution for their particular application of 3D Imaging technologies. Being able to offer software from Geomagic greatly aids us in realizing this vision.” -Sam Billingsley, VP of Business & Product Development, SmartGeoMetrics.


blog-nashville.jpg

August 28, 2013

Water Works Cistern

Houston, Texas … (March 22, 2012) SmartGeoMetrics™, a division of SmartMultiMedia™, Inc., and Geophysical Data Management (GDM) announced that SmartGeoMetrics has acquired the High Definition Surveying /Laser Scanning and 3D Imaging division of GDM.  This includes GDM’s Nashville office which will be added to SmartGeoMetrics’ growing footprint including offices in Houston, Texas and San Fernando, Trinidad, West Indies.

Additionally, Sam Billingsley, PLS, joins SmartGeoMetrics as Vice President of Business and Product Development. Billingsley has extensive experience in both traditional and High Definition Surveying and is well known in the industry through his many speaking engagements and weekly industry blog for SPAR View. Billingsley will continue to manage the Nashville branch in addition to his corporate responsibilities with SmartGeoMetrics. This acquisition will increase the service offerings in Nashville to include all of the services currently offered by SmartGeoMetrics.

Geophysical Data Management will continue to offer all of their other services including traditional land surveying and positioning services from their home office in Dallas, Texas.

The official press release can be found here.


blog-sam-1.jpg

August 28, 2013

Sam Billingsley, SmartGeoMetrics’ Vice President of Business and Product Development, has been invited to present at the SPAR 2012 Conference in The Woodlands (Houston), TX April 15-18, 2012. Sam will be presenting in the Heritage Track on “Using 3D Imaging Tools to Enhance Historic Environments”.

SmartGeoMetrics is also participating as a Corporate Sponsor of SPAR 2012. If you are attending visit our booth in the Exhibit Hall!